Pipeline
Pull the latest pipeline data for the current year to date and explore it with pivots and slicers — about 5 minutes.
Before you start
Make sure the Antenna add-in is installed in Excel. If it isn't, follow the installation guide first.
What you'll learn
- How to extract the latest pipeline data with a single Antenna formula
- How to refresh the underlying data and confirm it's up to date
- How to explore the results using the summary pivot and slicers
Formulas in this tutorial
The main formula you'll use:
For full inputs and outputs, see the Pipeline formula reference.
Step 1 – Extract the latest pipeline data
Goal: Activate the Antenna formula so the workbook pulls the most recent pipeline data.
Steps:
-
On the 'Pipeline - AOD' tab, remove the leading apostrophe (
') from cell A1 to uncomment the formula. Antenna then extracts the latest available pipeline data.
Need a hard refresh?
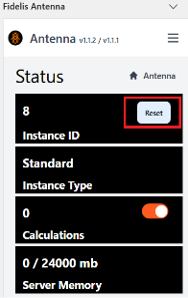
You can force the formulas to re-evaluate by opening the Antenna pane and clicking Reset.
Step 2 – Refresh the data
Goal: Update the Pipeline Data table that feeds the pivot tables, and confirm the data is current.
Steps:
-
Go to Data → Queries & Connections and click Refresh All. This refreshes the Pipeline Data table that the pivot tables use.

-
Confirm the Snapshot Date shows today's date — that's your check that the data is up to date.
Tip
You can speed up the workbook by cutting the dataset down to only the class(es) of business you care about. Smaller tables mean a faster, more responsive workbook. ☕
Step 3 – Explore the summary
Goal: Review the pipeline data through the summary pivot and slice it the way you need.
Steps:
-
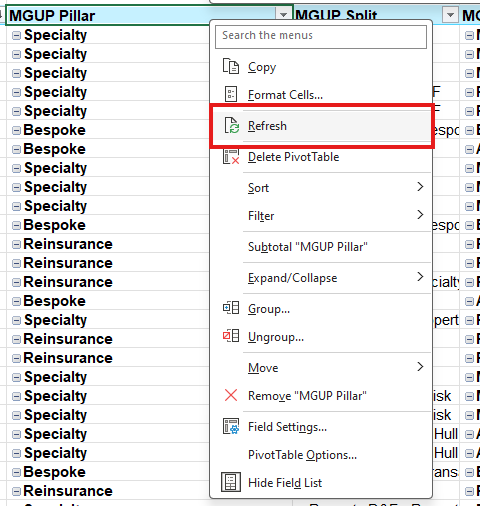
Open the Pipeline sheet, right-click the pivot table, and click Refresh. 📊
-
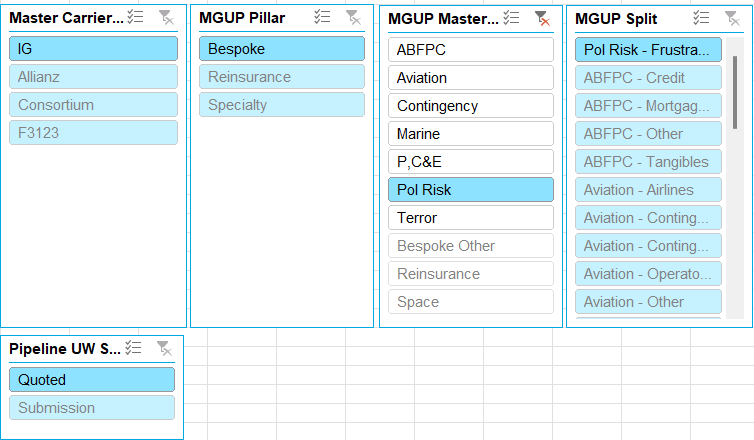
Use the slicers to explore the data across different partitions.
Recap ✅
- Uncommented the
=ANT.ACT.Live.TFPP_Pipeline()formula on the Pipeline - AOD tab - Refreshed the data and confirmed the snapshot date is today
- Explored the summary pivot using the slicers
What's next →
Move on to Premium to learn the class-mapping workflow and how to work with analytics data.
Feedback 💬
Tell us how this tutorial worked for you: