Triangles
Extract premium and claims triangle data, convert it to stable tables, and analyse it across aggregation levels and triangle types — about 15 minutes.
Before you start
Make sure the Antenna add-in is installed in Excel. If it isn't, follow the installation guide first.
What you'll learn
- How to extract a class mapping and triangle data, and convert them to stable tables
- How to change aggregation levels and switch between premium, reserving, and binder triangle types
- How to read the triangle metrics in the summary report
Formulas in this tutorial
The main formulas you'll use:
=ANT.ACT.Mappings.get_class_mapping()
=ANT.ACT.Live.Premium_Triangles()
=ANT.ACT.Live.Event_Name_Triangles()
For full inputs and outputs, see the Triangles formula reference.
Step 1 – Extract the data
Goal: Pull the class mapping and triangle data, and convert each to a stable Power Query table you can safely refresh.
Steps:
-
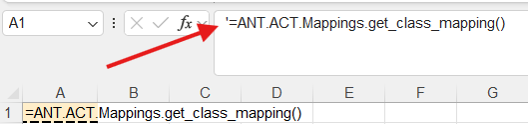
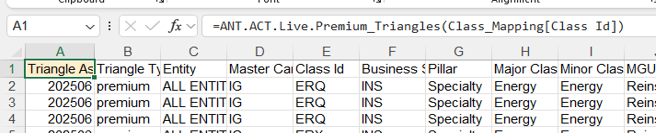
Open the 'Class Mapping - AOD' tab. Cell A1 contains the formula, commented out.
-
Remove the leading apostrophe (
') from cell A1 to activate the formula: -
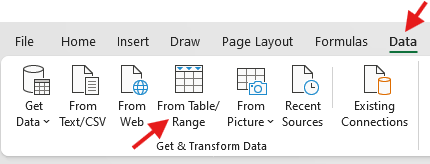
Select cell A1, then go to Data → From Table/Range to open Power Query.
-
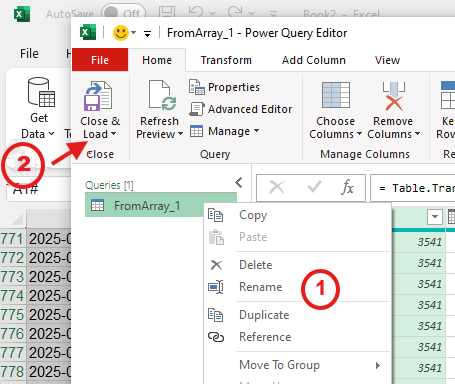
In Power Query, rename the source (e.g. FromArray_1 → Class Mapping), then click Close & Load.
Tip
The Class Mapping table is a utility table used by the other formulas. While editing in Power Query, you can keep just the class you're working with.
Why convert to a Table?
- Tables protect your report from unexpected column-order or count changes.
- You control when and how the data refreshes (the formula itself refreshes automatically on open).
-
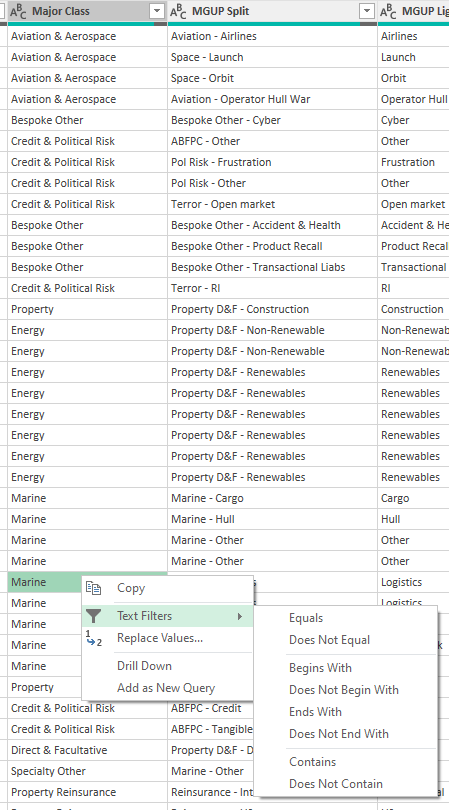
Filter for Marine data (used as the example here): Major Class → Text Filters → Equals → Marine.
-
Uncomment the formulas on the 'Premium Triangles - AOD' and 'Claims Triangles - AOD' tabs. Both use the Class Mapping table you just created. Convert each output into a Table, following the same steps as the Class Mapping.
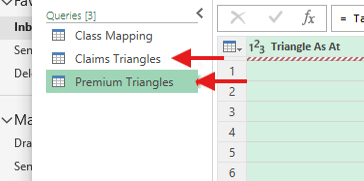
You should now see these tables in your Power Query editor:
Options for the original - AOD tab:
- Option 1 (recommended): Hide the
- AODtab if you plan to refresh regularly. - Option 2: If your dataset is large (>10k rows), comment the formula again and hide the tab to speed up workbook open times.
Tip
Append - AOD to extraction tabs (e.g. Premium Triangles - AOD) so it's obvious which sheet is the source.
Step 2 – Explore aggregation levels
Goal: Change the granularity of the triangle data by toggling the analytics flags, then refresh and review the results on the '2. Fields' tab.
Using the other parameters

Above, the show_entities parameter is enabled, so the data is split at entity level.
Steps:
- Set
show_mgas = TRUE, then refresh — shows MGA-level data. - Set
show_entities = TRUE, then refresh — shows the Entity-level split (FUL, FIID, FIBL). - Set
show_brokers = TRUE, then refresh — shows Broker-level data by broker grouping. - Set
show_layer_ids = TRUE(ensureclass_idsis not blank ⚠️), then refresh — shows data at the lowest level.
Note
The hierarchy runs from MGAs (highest) → Entities → Brokers → Layer IDs (most granular). Each level also includes its higher-level groupings:
show_entities = Truereturns Entities and their parent MGAs.show_brokers = Truereturns Brokers with their related Entities and MGAs.show_layer_ids = Trueexpands the view fully, down to Layer ID with all higher-level groupings.
Choosing a triangle type
The triangle formulas also take a triangle_type parameter: reserving, premium, or binder.
Tip
The difference between premium/reserving and binder:
binder: typically used for MGAs, with triangles developed from the inception of the binder.premiumandreserving: developed from the standard underwriting year.
| Option | Available Formulas | Description |
|---|---|---|
binder |
All triangle formulas | Provides triangle data related to binders |
premium |
=ANT.ACT.Live.Premium_Triangles() |
Provides premium-related triangle data |
reserving |
=ANT.ACT.Live.Event_Name_Triangles() =ANT.ACT.Live.Reserving_Triangles() |
Provides reserving-related triangle data |
Step 3 – Use the data
Goal: Read the summary triangle report and choose the metrics you want to view.
Steps:
- Go to the 'Using the Data' sheet. The template shows a simple triangle report across the classes you're considering, and lets you pick metrics from both the Premium Triangles and Claims Triangles outputs.
The metric fields you can choose from:
| Metric Fields | Definition |
|---|---|
| Incremental Gross Gross Written Premium USD | Gross of reinsurance gross of acquisition costs written premium in USD |
| Incremental Gross Net Written Premium USD | Gross of reinsurance net of acquisition costs written premium in USD |
| Incremental Gross Gross Earned Premium USD | Gross of reinsurance gross of acquisition costs earned premium in USD |
| Incremental Gross Net Earned Premium USD | Gross of reinsurance net of acquisition costs earned premium in USD |
| Incremental Gross Paid Claims USD | Gross Paid Claims in USD |
| Incremental Gross Incurred Claims USD | Gross Incurred Claims in USD (Paid + Outstanding) |
Recap ✅
- Extracted the class mapping and triangle data, and converted them to Tables
- Changed aggregation levels and chose a triangle type
- Read the summary triangle report
What's next →
Move on to Reserving to extract and analyse reserving master and events data.
Feedback 💬
Tell us how this tutorial worked for you: